

Image Details
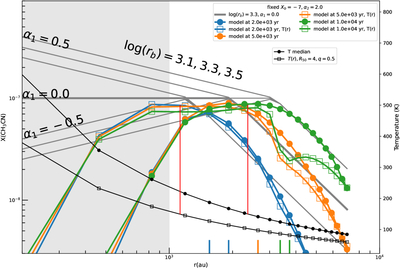
Caption: Figure C1.
Model results (color-coded lines with filled circles or squares) with fitted abundance profiles (solid gray lines with different parameters). The color-coded lines with points and squares are for models Tmedian and Tfunc respectively. The black lines show temperature profiles used in our two models: Tmedian and Tfunc (right axis). Temperature of 150 K are marked for the two temperature profiles with red vertical lines. At the bottom, small vertical lines indicate radii with a modeled abundance of 0.85Xpeak, serving as a rough estimation of break radii from the models. Note: T(r) = Tfunc.
Other Images in This Article
Show More
Copyright and Terms & Conditions
© 2026. The Author(s). Published by the American Astronomical Society.

Copyright ©
2026 Astronomy Image Explorer. All Rights Reserved.
