

Image Details
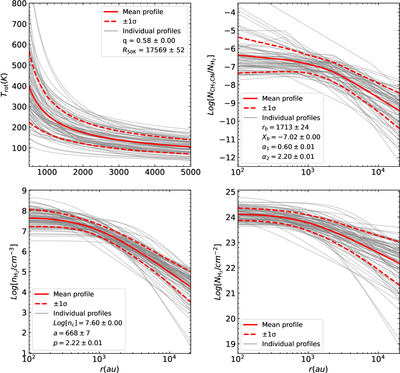
Caption: Figure 4.
The radial profiles of temperature (upper left), CH3CN abundance (upper right), H2 volume density (lower left) and column density (lower right) for all HMCs. The thin gray lines are the profiles for individual HMCs. The solid red lines present the averaged profile, and the dashed red lines indicate the 1σ uncertainty ranges of the mean profiles. Note that we exclude the temperature profiles of I16348-4654-HC1 and I18056-1952-HC1, as their unusually high temperatures significantly deviate from those of the other HMCs and are likely unreliable. The average temperature, CH3CN abundance and volume density profile can be fitted with Equations (4), (7), and (5), respectively. The best-fit parameters are labeled in the corresponding panels.
Other Images in This Article
Show More
Copyright and Terms & Conditions
© 2026. The Author(s). Published by the American Astronomical Society.

