

Image Details
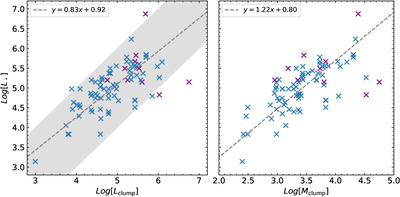
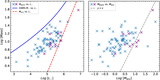
Caption: Figure 9.
The protostellar luminosity versus the clump luminosity (left panel) and mass (right panel). The gray shadow shows the region between y = x ± 1. The purple crosses indicate dust-ff hot cores, and the blue ones represent the rest of the hot cores. The gray dashed line is the best-fitting result.
Other Images in This Article
Show More
Copyright and Terms & Conditions
© 2026. The Author(s). Published by the American Astronomical Society.

Copyright ©
2026 Astronomy Image Explorer. All Rights Reserved.
