

Image Details
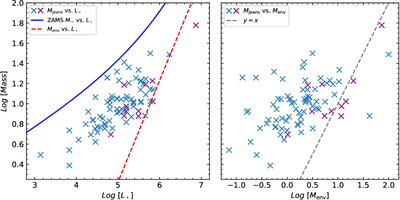
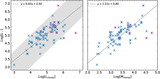
Caption: Figure 8.
Left panel: comparison of different mass scales as a function of the embedded protostellar luminosity, L⋆. The crosses show the thermal Jeans mass, MJeans, versus L⋆. The blue solid line shows the ZAMS stellar mass, M⋆, as a function of L⋆ (D. Szécsi et al. 2022; P. Hennebelle & M. Y. Grudić 2024). The red dashed line shows the relation between the envelope mass, Menv, and L⋆ (Figure 7(c)). Right panel: the scatter between the envelope mass and thermal Jeans mass. The dashed gray line presents y = x. The purple crosses indicate dust-ff hot cores, and the blue ones represent the rest of the hot cores.
Other Images in This Article
Show More
Copyright and Terms & Conditions
© 2026. The Author(s). Published by the American Astronomical Society.

