

Image Details
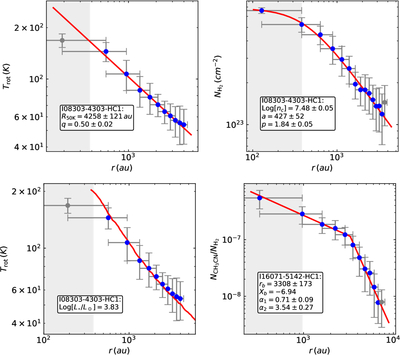
Caption: Figure 3. Fitting results for the radial profile of different parameters
The complete figure set (82 images) is available in the online journal.
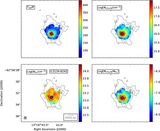
Representative example for the fitting results for the radial profile of different parameters. Upper left and lower left panels display the binned radial temperature profile derived from the CH3CN rotational temperature map, but the different models (upper: Equation (4); lower: RADMC-3D model) are used to fit both in order to get different physical quantities. The upper right panel and lower right panel show the binned radial H2 column density profile and the CH3CN abundance profile, which were derived from the H2 column density map and the CH3CN abundance map shown in the lower left and lower right panels of Figure 2, respectively. The data points used for the radial profile fit are shown in blue, while gray points are excluded from the model fits. The red solid lines show the best-fitted models. All physical parameters derived from the fits are shown in the legend of each panel. The inner unresolved region is shown as a gray-shaded area.
Other Images in This Article
Show More
Copyright and Terms & Conditions
© 2026. The Author(s). Published by the American Astronomical Society.

