

Image Details
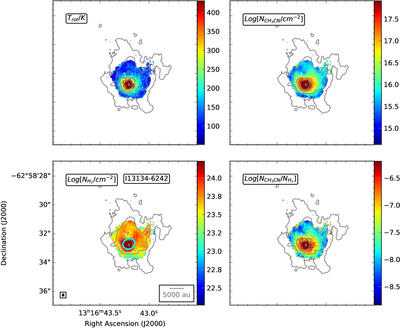
Caption: Figure 2. Field images
The complete figure set (58 images) is available in the online journal.
Example images for field I13134-6242 showing the spatial distribution of different parameters. The corresponding physical quantities are labeled in the upper left corner of each panel. Upper panels: rotational temperature map (left panel) and CH3CN column density map (right panel) produced by simultaneously fitting the multitransitions of CH3CN (12–11) pixel by pixel using spectuner. Lower left panel: H2 column density map derived from CH3CN rotational temperature map and 1.3 mm continuum map. The cyan ellipses outline the hot core structures identified by astrodendro. The synthesized beam is shown in the lower left corner, and the scale bar is indicated in the lower right corner. Lower right panel: CH3CN abundance map. The gray contours for the four panels represent the 1.3 mm continuum. The contour levels were plotted from 3σcont (1.5 mJy beam−1) to 0.95 times the peak value, with five logarithmically spaced contours between these values.
Other Images in This Article
Show More
Copyright and Terms & Conditions
© 2026. The Author(s). Published by the American Astronomical Society.

