

Image Details
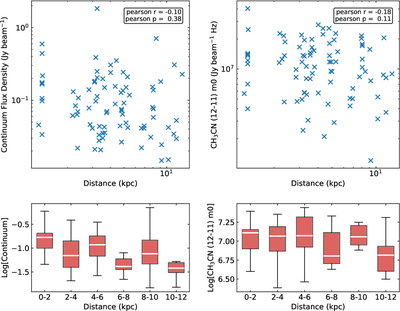
Caption: Figure B1.
Dependence of the continuum flux density and CH3CN (12–11, K = 0–4) line-integrated intensity on the distance. The top panels show the 1.3 mm continuum (peak) flux density versus the distance (left) and the CH3CN (12–11, K = 0–4) line-integrated intensity versus the distance (right) for all cores. The corresponding Pearson correlation coefficients and p-values are indicated in the top right corner of each panel. The bottom panels present box plots of the 1.3 mm continuum intensity (left) and the CH3CN (12–11, K = 0–4) line-integrated intensity (right) for cores grouped into 2 kpc distance bins. The boxes represent the interquartile range (25%–75%), while the white horizontal lines indicate the median values.
Other Images in This Article
Show More
Copyright and Terms & Conditions
© 2026. The Author(s). Published by the American Astronomical Society.

