

Image Details
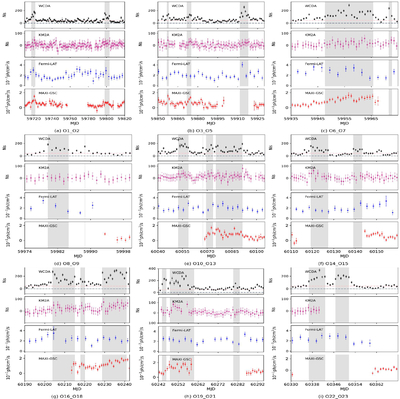
Caption: Figure 20.
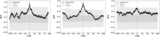
The MWL light curves of the 23 outburst episodes are constructed using data from LHAASO, Fermi-LAT, and MAXI-GSC. Shadowed regions demarcate the outburst durations, while the top subplot features gray and pink dashed lines corresponding to the zero-flux level and steady-state signal, respectively.
Other Images in This Article
Show More
Copyright and Terms & Conditions
© 2026. The Author(s). Published by the American Astronomical Society.

Copyright ©
2026 Astronomy Image Explorer. All Rights Reserved.
