

Image Details
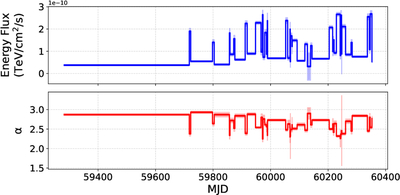
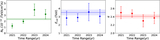
Caption: Figure 15.
Temporal distribution of the flux and spectral index during the 3 yr observation period. The upper panel shows the variation of the integrated energy flux over time for 23 outburst periods and the 24 quiescent intervals in between, while the lower panel presents the evolution of the photon index during the same periods. The blue (upper) and red (lower) curves represent the fitted results for each time segment, with the shaded areas indicating the 1σ statistical uncertainty bands.
Other Images in This Article
Show More
Copyright and Terms & Conditions
© 2026. The Author(s). Published by the American Astronomical Society.

Copyright ©
2026 Astronomy Image Explorer. All Rights Reserved.
