

Image Details
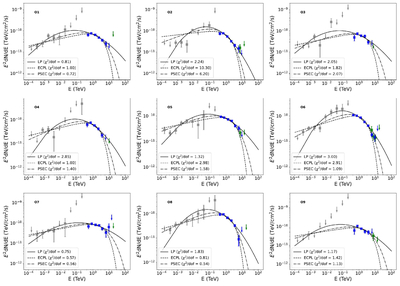
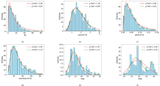
Caption: Figure 14.
Energy spectra of Mrk 421 during the 23 outbursts; simultaneous SEDs from Fermi-LAT are included. The first nine panels are relative to outbursts O1 to O9 based on joint observational data from LHAASO-WCDA, LHAASO-KM2A, and Fermi-LAT. The solid gray, blue, and green squares represent the observational results from Fermi-LAT and LHAASO (WCDA and KM2A), with arrows indicating the upper limits of flux. The solid line in the figure represents the fitting result of the log-parabola (LP) model, the dashed line represents the fitting result of the ECPL model, and the dotted line represents the fitting result of the PSEC model.
Other Images in This Article
Show More
Copyright and Terms & Conditions
© 2026. The Author(s). Published by the American Astronomical Society.

