

Image Details
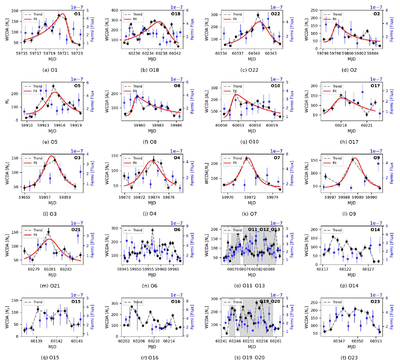
Caption: Figure 12.
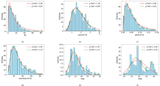
The detailed 23 outbursts’ light curves from LHASO-WCDA. Panels (a)–(c) show Group A with longer rising timescales, panels (d)–(h) show longer decay timescales, panels (i)–(m) show roughly symmetric timescales, and panels (n)–(t) show “outburst forests.” Here, the black points represent the light curves from WCDA, the blue points represent light curves from Fermi, and the red curves in Groups A, B, and C show the fitting results obtained using the Fred function.
Other Images in This Article
Show More
Copyright and Terms & Conditions
© 2026. The Author(s). Published by the American Astronomical Society.

Copyright ©
2026 Astronomy Image Explorer. All Rights Reserved.
