

Image Details
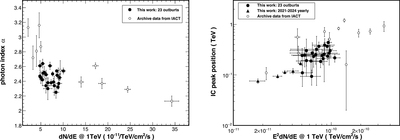
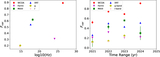
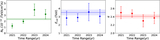
Caption: Figure 11.
Left panel: relationship between the intrinsic spectral index and the 1 TeV flux for the 23 outburst periods. Right panel: relationship between the fitted SED peak position and the 1 TeV flux. Data are shown for the 23 outbursts from this work (filled black circles), the annual SED results from this work (black triangles), and archival IACT measurements (open circles; J. Albert et al. 2007).
Other Images in This Article
Show More
Copyright and Terms & Conditions
© 2026. The Author(s). Published by the American Astronomical Society.

Copyright ©
2026 Astronomy Image Explorer. All Rights Reserved.
