Image Details
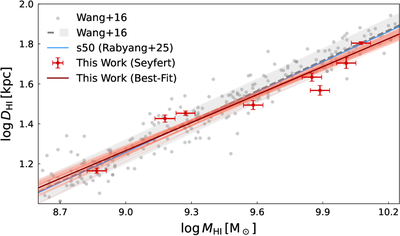
Caption: Figure 4.
The H I mass–size relation for eight Seyfert galaxies from GMRT observations. The red points with error bars represent our Seyfert sample. The solid red line denotes the best-fit linear regression derived via emcee, which yields a reduced chi-squared of ﹩{\chi }_{\nu }^{2}\approx 1.16﹩. The thin light red lines represent 50 random draws from the fitting. Data and the H I mass–size relation in J. Wang et al. (2016) are displayed by gray marks with a shaded band of 0.06 dex (J. Wang et al. 2016). The blue line is the SIMBA simulation result (see Table 4).
Other Images in This Article
Copyright and Terms & Conditions
© 2026. The Author(s). Published by the American Astronomical Society.
Copyright ©
2026 Astronomy Image Explorer. All Rights Reserved.