Image Details
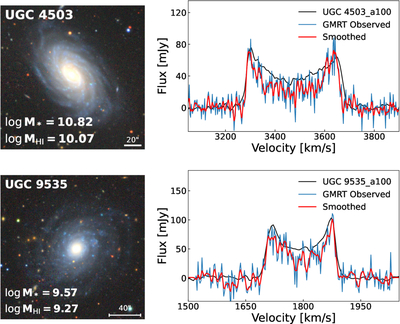
Caption: Figure 2.
Optical images and H I spectra of UGC 4503 and UGC 9535, two Seyfert galaxies in our sample. The left panels show their DECaLS grz color-composite images (A. Dey et al. 2019). In the right panels, we display their H I spectra. The black lines illustrate ALFALFA 21 cm single-dish spectra (M. P. Haynes et al. 2018) and blue lines correspond to our GMRT results. Red lines represent smoothed GMRT spectra using a Gaussian kernel with a standard deviation of σsmooth = 1 channel (corresponding to ∼2.6 km s−1). The stellar mass from ALFALFA and H I mass from GMRT observations are written on the red–green–blue images.
Other Images in This Article
Copyright and Terms & Conditions
© 2026. The Author(s). Published by the American Astronomical Society.