Image Details
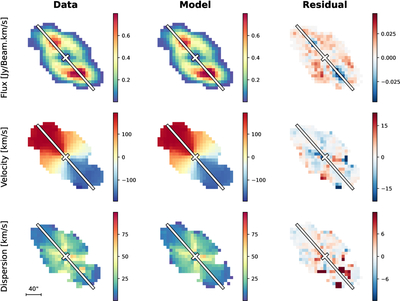
Caption: Figure 5.
The observed and modeled 2D maps for UGC 4503. The rows from top to bottom display H I flux maps, velocity maps, and velocity dispersion maps respectively. The columns represent the observed GMRT data, the best-fitting MCMC model, and the residuals. The long white solid lines indicate the position of the kinematic major axis. The color bars indicate the scale for each parameter.
Other Images in This Article
Copyright and Terms & Conditions
© 2026. The Author(s). Published by the American Astronomical Society.
Copyright ©
2026 Astronomy Image Explorer. All Rights Reserved.