Image Details
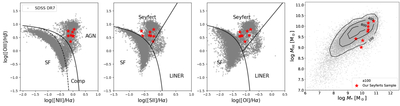
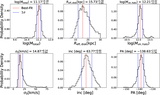
Caption: Figure 1.
General properties of our Seyfert galaxies. The red stars mark our targets in this work. The three leftmost panels are BPT diagrams. The dashed curve (G. Kauffmann et al. 2003) and the solid lines (L. J. Kewley et al. 2006) effectively divide all SDSS DR7 galaxies (dark gray dots) into star-forming (SF), Seyfert, low-ionization nuclear emission-line region (LINER), and composite (Comp) galaxies. The rightmost graph plots logarithm H I mass versus stellar mass in solar units. The light gray dots are galaxies in the ALFALFA survey and contours represent the 100, 400, and 800 number density levels within a 0.25 × 0.25 bin.
Other Images in This Article
Copyright and Terms & Conditions
© 2026. The Author(s). Published by the American Astronomical Society.