Image Details
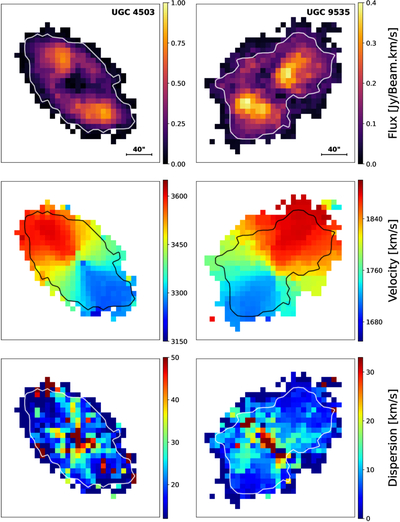
Caption: Figure 3.
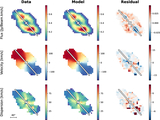
Overview of H I kinematic maps for UGC 4503 and UGC 9535. The left panels correspond to UGC 4503 and the right ones display UGC 9535. The H I intensity maps, velocity field maps, and velocity dispersion maps are presented from top to bottom, respectively. The white and black contours mark H I spatial distribution boundaries of our targets, which are defined when H I surface densities reach 1 M⊙ pc−2 (J. Wang et al. 2016).
Other Images in This Article
Copyright and Terms & Conditions
© 2026. The Author(s). Published by the American Astronomical Society.
Copyright ©
2026 Astronomy Image Explorer. All Rights Reserved.