Image Details
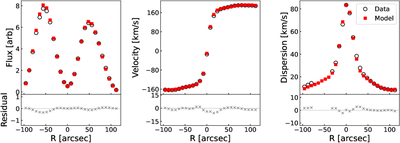
Caption: Figure 6.
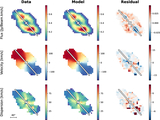
The observed and modeled 1D extractions for UGC 4503. The 1D radial extraction is along the major axis (indicated by the white slit in Figure 5). The top plots show the comparison between the observed data (black circles) and the best-fitting model (red squares) for flux, velocity, and velocity dispersion. The bottom plots display the corresponding residuals.
Other Images in This Article
Copyright and Terms & Conditions
© 2026. The Author(s). Published by the American Astronomical Society.
Copyright ©
2026 Astronomy Image Explorer. All Rights Reserved.