Image Details
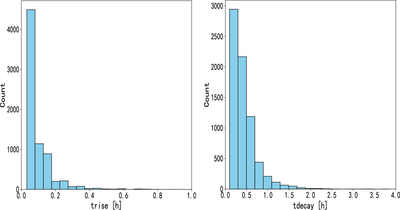
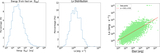
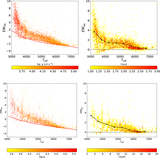
Caption: Figure 2.
The distribution of flare rise times and decay times. The left panel depicts the distributions of rise times for flare events, whereas the right panel shows the corresponding decay times.
Other Images in This Article
Show More
Copyright and Terms & Conditions
© 2026. The Author(s). Published by the American Astronomical Society.
Copyright ©
2026 Astronomy Image Explorer. All Rights Reserved.