Image Details
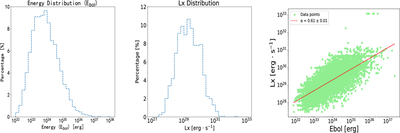
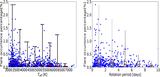
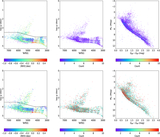
Caption: Figure 6.
Distribution of bolometric flare energy (left), X-ray luminosity (middle), and correlation between bolometric flare energy and X-ray luminosity (right). The red line in the right panel represents the best-fitting relation between Ebol and LX.
Other Images in This Article
Show More
Copyright and Terms & Conditions
© 2026. The Author(s). Published by the American Astronomical Society.
Copyright ©
2026 Astronomy Image Explorer. All Rights Reserved.