Image Details
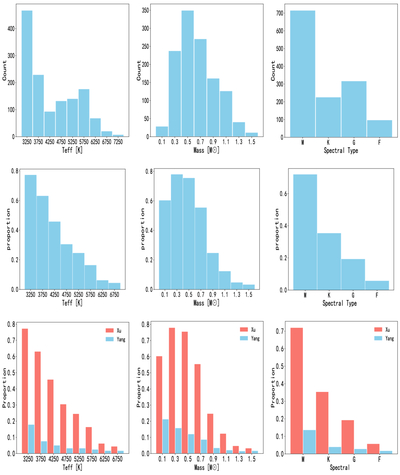
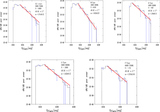
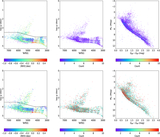
Caption: Figure 3.
Distribution of flare events across different temperatures, masses, and spectral types. The top panels present histograms of the number of flares for stars with different effective temperatures (Teff), masses, and spectral types. The middle panels illustrate the proportion of flare stars across these same parameters. The bottom panels presents a comparison between our results and those of Z. Yang et al. (2023); the red bars represent our results, while the blue bars correspond to the results of Z. Yang et al. (2023).
Other Images in This Article
Show More
Copyright and Terms & Conditions
© 2026. The Author(s). Published by the American Astronomical Society.
Copyright ©
2026 Astronomy Image Explorer. All Rights Reserved.