Image Details
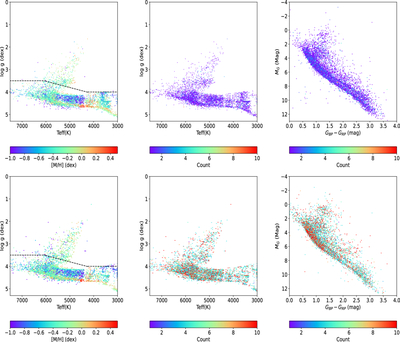
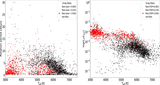
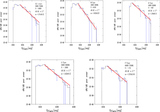
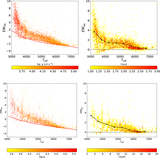
Caption: Figure 9.
The figures consist of two sets of panels: the top set represents low-resolution data, while the bottom set shows medium-resolution data. In the first set, the left panel displays the H–R diagram of atmospheric parameters, with a black dashed line delineating the boundary between giant stars and main-sequence stars, and color bars indicating [Fe/H]. The middle panel illustrates the density of atmospheric parameters in the H–R diagram, with color bars representing the number density of stars. The right panel features the color–magnitude H–R diagram, where the color bars again indicate the number density of stars. The second set of panels follow a similar structure, but are based on medium-resolution data.
Other Images in This Article
Show More
Copyright and Terms & Conditions
© 2026. The Author(s). Published by the American Astronomical Society.