Image Details
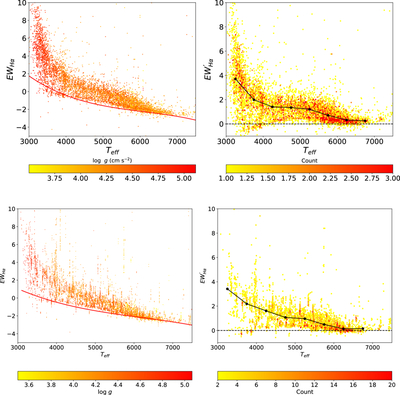
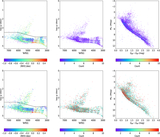
Caption: Figure 10.
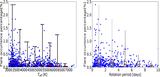
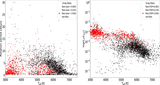
The relationship between Teff and EWHα (left panels) and between Teff and the residual ﹩{{\rm{EW}}}_{{\rm{H}}\alpha }^{{\rm{{\prime} }}}﹩ (right panels). In the left panels, points are colored by ﹩\mathrm{log}g﹩, and the red line represents a third-degree polynomial fit to the least active 2% of stars in each 100 K temperature bin. In the right panels, the color indicates the number density of stars, the black dashed line marks ﹩{{\rm{EW}}}_{{\rm{H}}\alpha }^{{\rm{{\prime} }}}=0﹩, and the black dotted line connects median residuals in 500 K temperature bins. The upper row corresponds to low-resolution data, and the lower row corresponds to medium-resolution data.
Other Images in This Article
Show More
Copyright and Terms & Conditions
© 2026. The Author(s). Published by the American Astronomical Society.