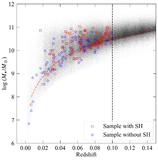
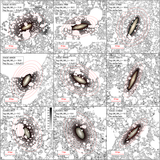
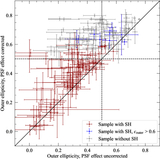
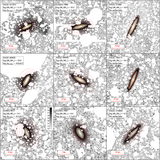
Image Details
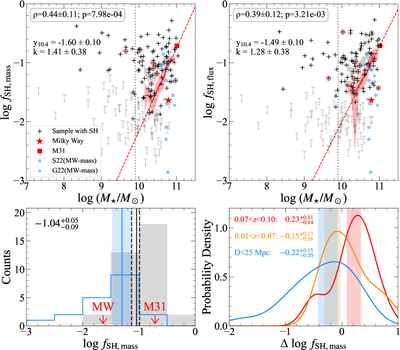
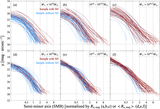
Caption: Figure 15.
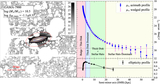
Stellar halo mass and flux fractions relative to host galaxies. Upper-left and -right panels: stellar halo mass/flux fraction vs. galaxy stellar mass. Black plus symbols denote galaxies with halo detections; those enclosed by red circles have power-law surface profiles and q < 0.4 in the outskirts. Gray arrows indicate upper limits for nondetections. The gray shaded region shows the rms scatter of mean fractions from 1000 bootstrap resamplings of detected halos in running stellar-mass bins. Literature measurements for the MW (red pentagram) and M31 (red square), and 17 nearby MW-mass galaxies (﹩10.5\lt {\rm{log}}{M}_{\star }/{M}_{\odot }\lt 11.0﹩) within 25 Mpc from (A. Smercina et al. 2022, S22) and (C. Gilhuly et al. 2022, G22; blue), are included. Spearman coefficients, uncertainties, and p-values for detected halos at ﹩{\rm{log}}{M}_{\star }/{M}_{\odot }\gt 10.3﹩ are listed. The red solid line and shaded region show the Kaplan–Meier (K-M) estimator median halo fractions and 1σ scatter over 0.5 dex running mass bins with 0.1 dex steps. Best-fit LINMIX relations for ﹩{\rm{log}}{M}_{\star }/{M}_{\odot }\,\geqslant \,10.2﹩, ﹩{\rm{log}}{f}_{{\rm{SH}}}=k({\rm{log}}{M}_{\star }-10.4)+{y}_{10.4}﹩, are shown as red dashed lines, with k and y10.4 listed. Lower-left panel: histograms of stellar halo mass fractions of MW-mass galaxies. Gray shaded and blue open histograms, respectively, represent galaxies from our sample and nearby galaxies within 25 Mpc. Vertical solid and dashed lines mark the median (based on K-M estimator for our sample) and the central 68% intervals. The blue shaded region represents the 68% confidence intervals from 1000 bootstrap resamplings of nearby galaxies. Lower-right panel: kernel density estimates of differential stellar halo fraction distributions for MW-mass galaxies within <25 Mpc and MW-mass galaxies below and above z = 0.07 in our sample. The differential halo mass fractions are derived by subtracting the median stellar halo mass fraction–galaxy mass relation from individual galaxies. Median values and 68% confidence intervals are shown by color-shaded regions and listed. See Section 4.6 for details.
Other Images in This Article
Show More
Copyright and Terms & Conditions
© 2026. The Author(s). Published by the American Astronomical Society.