Image Details
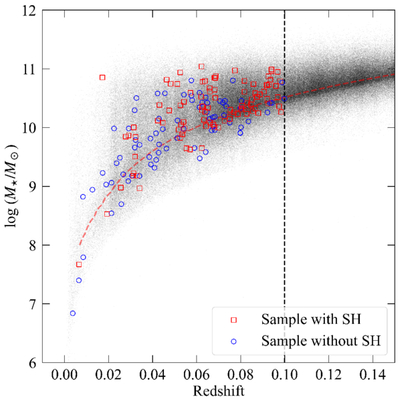
Caption: Figure 1.
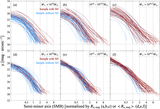
Distribution of our galaxies on the stellar mass–redshift plane. The background gray dots show the parent spectroscopic sample from SDSS DR7 and GAMA DR4, limited to galaxies with r < 17.77 mag. Blue open circles represent high-inclination central galaxies without stellar halo detections, while red open squares mark galaxies with stellar halo detections. The vertical dashed line indicates the upper redshift limit applied in our sample selection. The red dashed curve represents the 95% completeness limit of our parent sample of central galaxies. Stellar masses plotted here are all taken from the parent catalogs.
Other Images in This Article
Show More
Copyright and Terms & Conditions
© 2026. The Author(s). Published by the American Astronomical Society.