Image Details
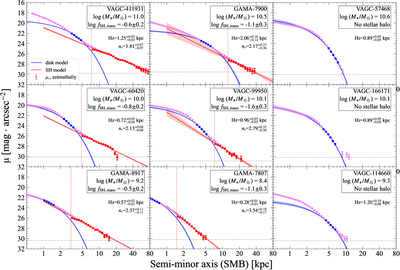
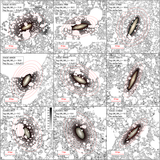
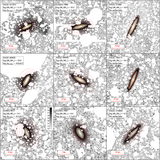
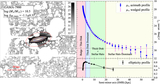
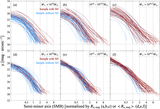
Caption: Figure 8.
Examples of stellar halo measurements from surface brightness profiles. Each panel shows one of the same galaxies presented in Figure 6. Violet squares with error bars represent the r-band azimuthally median surface brightness profiles along the minor axis. Blue squares indicate the outer disk (thick-disk)-dominated region used for fitting an exponential model, with the best-fit exponential overplotted as blue curves. Red squares show the disk-subtracted surface brightness profiles used for power-law fitting (red curves) of the halo-dominated region. The red vertical dashed line marks the inner boundary of the stellar-halo-dominated region adopted for halo profile fitting, and the gray horizontal dashed line indicates the 2σ surface brightness limit. The best-fit thick disk exponential scale height and the stellar halo power-law index are also indicated in each panel. See Section 3.3.2 for details.
Other Images in This Article
Show More
Copyright and Terms & Conditions
© 2026. The Author(s). Published by the American Astronomical Society.