Image Details
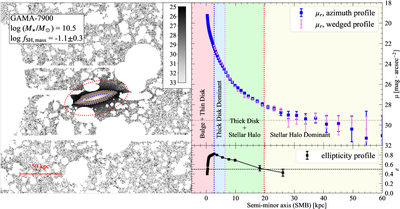
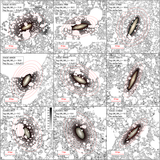
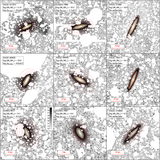
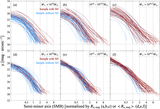
Caption: Figure 7.
An example of identifying the stellar halo-dominated regions. Left panel: a composite image of a galaxy, produced in a similar way to that shown in Figure 6. Colored dotted ellipses mark the division of the radial ranges dominated by different galaxy components (i.e., bulge, thin disk, thick disk, and stellar halo). Upper-right panel: radial surface brightness profiles along the minor axis. Blue squares with error bars show the azimuthally median profiles, while violet circles represent the median profiles measured within 60° wedges around the minor axis above and below the disk plane. The horizontal dashed line indicates the 2σ surface brightness limit. Vertical dotted lines mark the same division radii as represented by the ellipses in the left panel, using the same color scheme as the ellipses. Lower-right panel: isophotal ellipticity profile. All radial profiles are plotted as a function of galactocentric distance along the semiminor axis (SMB) in kiloparsecs. See Section 3.3.1 for details.
Other Images in This Article
Show More
Copyright and Terms & Conditions
© 2026. The Author(s). Published by the American Astronomical Society.