Image Details
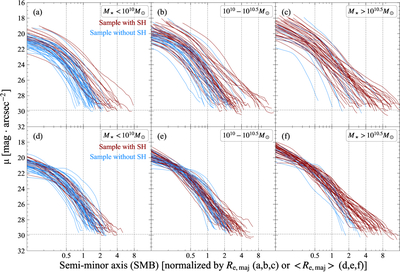
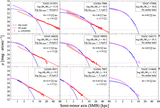
Caption: Figure 9.
The r-band azimuthally median surface brightness profiles along the minor axis of all sample galaxies, shown in units of Re,maj (upper panels) or 〈Re,maj〉 (lower panels). Galaxies are grouped by stellar mass range in different columns, as indicated in each panel. Here, Re,maj denotes the half-light radius along the major axis, and 〈Re,maj〉 represents the mass-dependent average Re,maj predicted by a piecewise log–log linear fit to the Re,maj–stellar mass relation of our galaxies. Dark-red profiles indicate galaxies with stellar halo detections, while blue profiles indicate galaxies without stellar halo detections. This figure demonstrates that surface brightness profiles normalized by the average major-axis half-light radius exhibit substantially smaller scatter than those normalized by each galaxy’s own half-light radius. See Section 3.3.3 for details.
Other Images in This Article
Show More
Copyright and Terms & Conditions
© 2026. The Author(s). Published by the American Astronomical Society.