Image Details
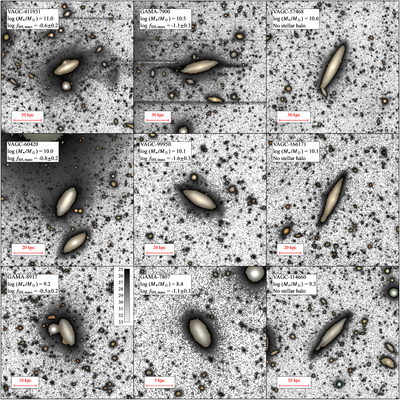
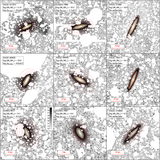
Caption: Figure 2.
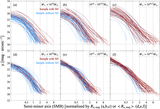
HSC-SSP Deep/UltraDeep images of nine representative galaxies in our final sample of high-inclination central galaxies. For each galaxy, the g-, r-, and i-band tricolor image of the high surface brightness central region is combined with the white-light gray-scale image to reveal the lower surface brightness outskirts. Images are rebinned to enhance visibility of the low-surface-brightness outskirts. The first row shows galaxies with MW-like stellar masses, ﹩{\rm{log}}({M}_{\star }/{M}_{\odot })\sim (10.5,\,11.0)﹩. The second row displays galaxies with ﹩{\rm{log}}({M}_{\star }/{M}_{\odot })\sim (10.0,\,10.5)﹩. The last row represents galaxies with the lowest stellar masses, ﹩{\rm{log}}({M}_{\star }/{M}_{\odot })\lt 10.0﹩. The first column depicts galaxies with high stellar halo fractions, ﹩{\rm{log}}{f}_{{\rm{halo}}}\gt -1﹩. The middle column shows galaxies with moderate stellar halo fractions, ﹩{\rm{log}}{f}_{{\rm{halo}}}\sim (-2,\,-1)﹩. The last column shows galaxies without stellar halo detections. The color bar of the gray-scale image in the lower-left panel is in units of mag arcsec−2.
Other Images in This Article
Show More
Copyright and Terms & Conditions
© 2026. The Author(s). Published by the American Astronomical Society.