Image Details
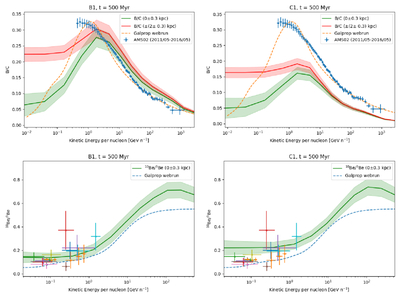
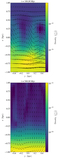
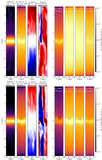
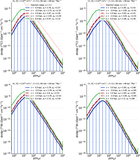
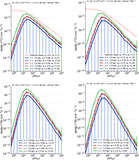
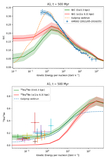
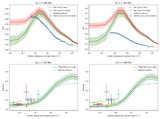
Caption: Figure 11.
The same B/C and 10Be/9Be plots as the previous Figures 8 and 9 for the B1 and C1 models, only differing from the fiducial case by the diffusion coefficient and diffusion power index. The left panels have ﹩{D}_{\parallel }^{0}=6\times 1{0}^{28}\ {\mathrm{cm}}^{2}\,{{\rm{s}}}^{-1}﹩ and δ = 0.3, and the right panels have ﹩{D}_{\parallel }^{0}=3\times 1{0}^{28}\ {\mathrm{cm}}^{2}\,{{\rm{s}}}^{-1}﹩ and δ = 0.5.
Other Images in This Article
Show More
Copyright and Terms & Conditions
© 2026. The Author(s). Published by the American Astronomical Society.
Copyright ©
2026 Astronomy Image Explorer. All Rights Reserved.