Image Details
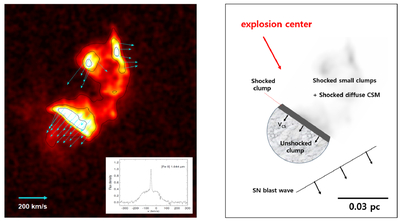
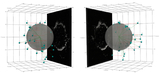
Caption: Figure 9.
(Left) Proper-motion map of Knot 24 as shown in Figure 2. The background image is the 2014 HST F625W image, with contours indicating the brightness distribution. The inset displays the average [Fe II] 1.644 μm spectrum of Knot 24 adapted from B.-C. Koo et al. (2020). North is up, and east is to the left. (Right) A schematic figure describing the key features of Knot 24 and its surrounding environment.
Other Images in This Article

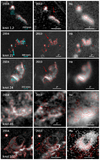
Show More
Copyright and Terms & Conditions
© 2025. The Author(s). Published by the American Astronomical Society.
Copyright ©
2025 Astronomy Image Explorer. All Rights Reserved.