Image Details
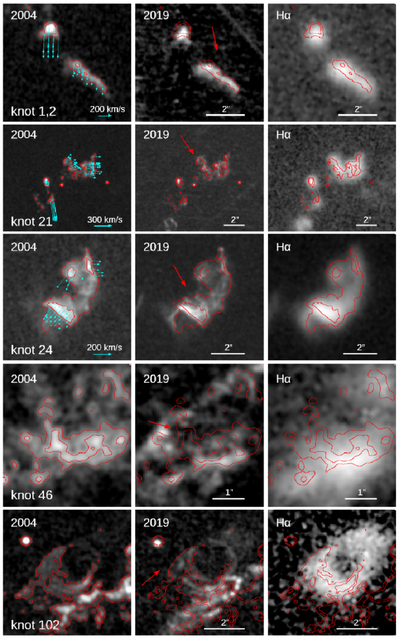
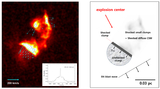
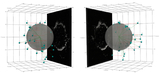
Caption: Figure 2.
Sample QSFs illustrating typical proper-motion results: Knots 1 and 2, 21, 24, 46, and 102 from top to bottom. For each QSF, three frames are presented: (Left) A 2004 HST F625W image of the QSF with proper-motion vectors overlaid in cyan. The red contours indicate the boundary of the QSF. (Middle) A 2019 HST F625W image with the red contours from the 2004 image overlaid. The red arrow indicates the radial direction from the explosion center. (Right) A Gemini Hα image of the QSF with red contours from the 2004 image overlaid. The image was obtained in 2019 with an angular resolution of 0﹩\mathop{.}\limits^{\unicode{x02033}}﹩6 and has been regridded to match the HST images. In each frame, north is up, and east is to the left. At the distance of Cas A (3.4 kpc), 2″ corresponds to 0.033 pc. A full set of proper-motion maps of 36 QSFs is listed in Figure 11.
Other Images in This Article

Show More
Copyright and Terms & Conditions
© 2025. The Author(s). Published by the American Astronomical Society.