Image Details
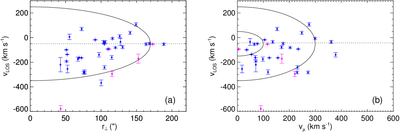
Caption: Figure 8.
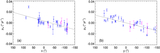
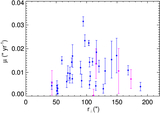
(a) vLOS vs. r⊥. The solid line represents the relationship when the QSFs are confined to a thin spherical shell near the SN blast wave at r = 170″ and expand radially at 300 km s−1. (b) vLOS vs. vμ. The solid lines represent the relationship when the QSFs expand radially at 100 or 300 km s−1. In both panels, the dotted horizontal lines mark the systemic LOS velocity of the Cas A SNR. Blue symbols indicate Group 1 QSFs, while magenta symbols represent Group 2 QSFs. Radial velocities are adopted from A. Alarie et al. (2014) (see Table 2).
Other Images in This Article

Show More
Copyright and Terms & Conditions
© 2025. The Author(s). Published by the American Astronomical Society.
Copyright ©
2025 Astronomy Image Explorer. All Rights Reserved.