Image Details
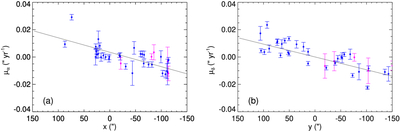
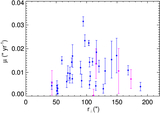
Caption: Figure 5.
(a) R.A. component of the proper motion of QSFs vs. their projected distance from the expansion center along R.A. The solid line represents the least-squares fit. (b) Same as (a), but for the decl. component of the proper motion. Blue symbols indicate Group 1 QSFs, while magenta symbols represent Group 2 QSFs.
Other Images in This Article

Show More
Copyright and Terms & Conditions
© 2025. The Author(s). Published by the American Astronomical Society.
Copyright ©
2025 Astronomy Image Explorer. All Rights Reserved.