Image Details
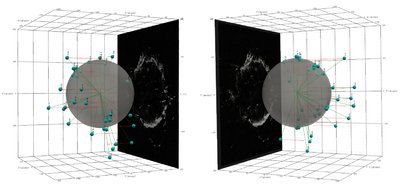
Caption: Figure 10.
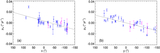
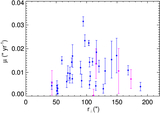
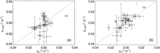
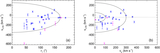
A model for the 3D distribution of optically bright QSFs in Cas A. Two angled perspectives are shown: one viewed from 60° west of the LOS (left) and the other from 60° east of the LOS (right), are shown. A translucent sphere represents the surface at a radius of 100″ (1.6 pc) from the explosion center. Knots are assumed to lie within the SNR boundary (rSNR = 170″, or 2.8 pc), unless projected outside this circular boundary on the sky. See Appendix B for details. The user can rotate and zoom the interactive figure. The 3D model is visualized using the Python package PyVista (B. Sullivan & A. Kaszynski 2019).
An interactive version of this figure is available in the online article.
An interactive version of this figure is available.
An interactive version of this figure is available in the online journal.
Other Images in This Article

Show More
Copyright and Terms & Conditions
© 2025. The Author(s). Published by the American Astronomical Society.