

Image Details
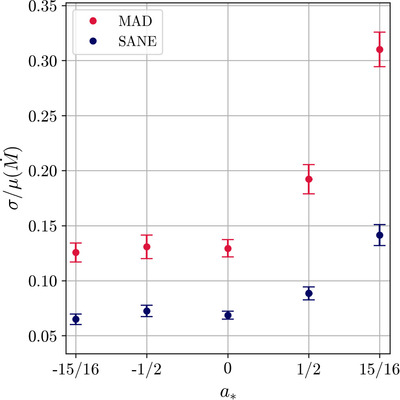
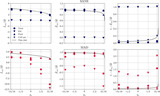
Caption: Figure 5.
The 3 hr modulation index M3 for the accretion rate ﹩\dot{M}﹩ (defined as MΔt ≡ σΔt/μΔt; here Δt = 3 hr). To estimate the average M3 (indicated by a marker for each simulation in this plot) for Sgr A* (which has a characteristic timescale tg ∼ 20 s), we extract as many independent 3 hr time segments from the ﹩\dot{M}﹩ time series from t = 15,000 tg to t = 30,000 tg (∼27) and compute the average sample mean. The error bars plot the standard error of the sample means (﹩\sim {\sigma }_{{{\rm{M}}}_{3}}/\sqrt{27}﹩) and quantify the uncertainty in our measurement of M3.
Other Images in This Article
Show More
Copyright and Terms & Conditions
© 2025. The Author(s). Published by the American Astronomical Society.

Copyright ©
2026 Astronomy Image Explorer. All Rights Reserved.
