

Image Details
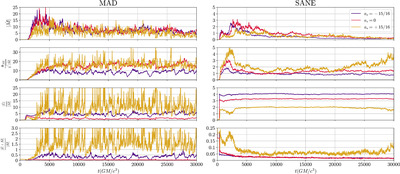
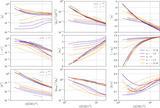
Caption: Figure 2.
Time series of the horizon-penetrating fluxes for six models: a* = { −15/16, 0, +15/16}, MAD and SANE. Left column: MAD simulations. Right column: SANE simulations. Top row: rest-mass accretion rate. Second row: dimensionless magnetic flux. Third row: normalized, absolute angular momentum flux. Bottom row: normalized absolute energy flux with the contribution from rest mass subtracted. a* = −15/16 simulations are plotted in indigo, a* = 0 simulations in crimson, and a* = +15/16 in gold.
Other Images in This Article
Show More
Copyright and Terms & Conditions
© 2025. The Author(s). Published by the American Astronomical Society.

Copyright ©
2026 Astronomy Image Explorer. All Rights Reserved.
