

Image Details
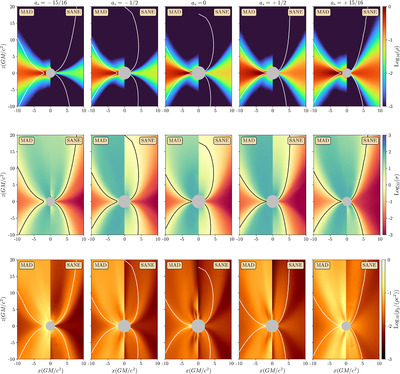
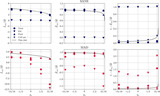
Caption: Figure 7.
Top to bottom: time- and azimuth-averaged poloidal plots of ρ, σ ≡ b2/ρ, and Θ ≡ pg/(ρc2), respectively. Each column represents a different black hole spin. In each subplot, the left panel shows the MAD simulation, while the right panel shows the corresponding SANE simulation. Contours in each plot indicate σ = 1. Note that for quantities defined as ratios, such as magnetization σ and fluid temperature Θ, the averages are taken separately, e.g., 〈σ〉 = 〈b2〉/〈ρ〉.
Other Images in This Article
Show More
Copyright and Terms & Conditions
© 2025. The Author(s). Published by the American Astronomical Society.

Copyright ©
2026 Astronomy Image Explorer. All Rights Reserved.
