

Image Details
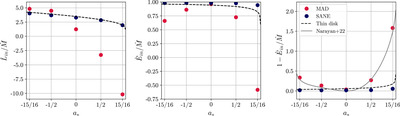
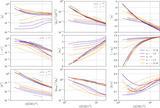
Caption: Figure 3.
Time-averaged radial fluxes as a function of black hole spin. The data points in red (blue) denote MAD (SANE) simulations. The dashed line plots the value expected for a thin disk at the ISCO. Left panel: specific angular momentum flux. Middle panel: specific energy flux. Right panel: ratio of outflow power (﹩\dot{E}-\dot{M}﹩) to rest-mass accretion rate.
Other Images in This Article
Show More
Copyright and Terms & Conditions
© 2025. The Author(s). Published by the American Astronomical Society.

Copyright ©
2026 Astronomy Image Explorer. All Rights Reserved.
