

Image Details
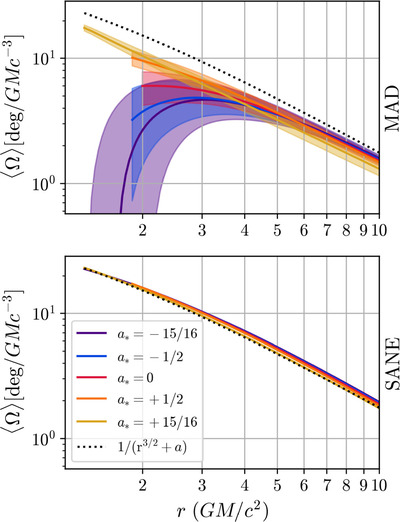
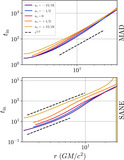
Caption: Figure 10.
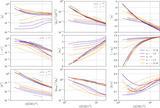
Angular velocity profiles 〈Ω〉 ≡ 〈uϕ〉/〈ut〉 in Kerr–Schild coordinates in units of deg/GM/c3. The solid line plots the time-average value, and the shaded region plots one standard deviation. The dotted black line is the Keplerian fit ﹩{{\rm{\Omega }}}_{K}={({r}^{3/2}+a)}^{-1}﹩ for a* = +0.94. The MAD rotational profiles are sub-Keplerian and have a significantly greater spread as compared to the SANE models. The SANE angular velocity agrees with the Keplerian expectation.
Other Images in This Article
Show More
Copyright and Terms & Conditions
© 2025. The Author(s). Published by the American Astronomical Society.

Copyright ©
2026 Astronomy Image Explorer. All Rights Reserved.
