

Image Details
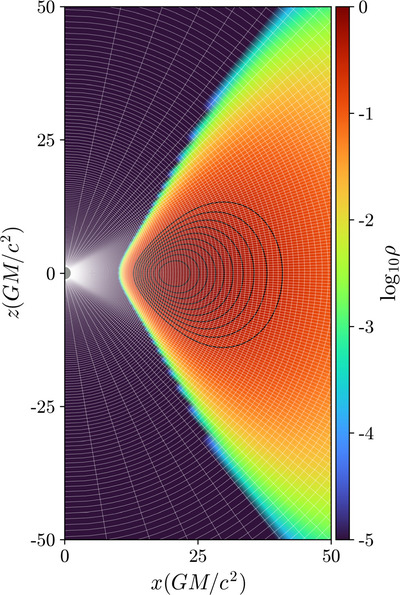
Caption: Figure 1.
Azimuthal/poloidal slice of initial conditions along with the grid geometry. The color scale denotes the logarithm of the rest-mass density, and as an example, we plot the magnetic fields structure (in black) for a SANE disk. The grid zone boundaries are represented by the white mesh. The grid zones are concentrated toward the equatorial plane and at smaller radii, where we expect most of the relevant physics to occur.
Other Images in This Article
Show More
Copyright and Terms & Conditions
© 2025. The Author(s). Published by the American Astronomical Society.

Copyright ©
2026 Astronomy Image Explorer. All Rights Reserved.
