

Image Details
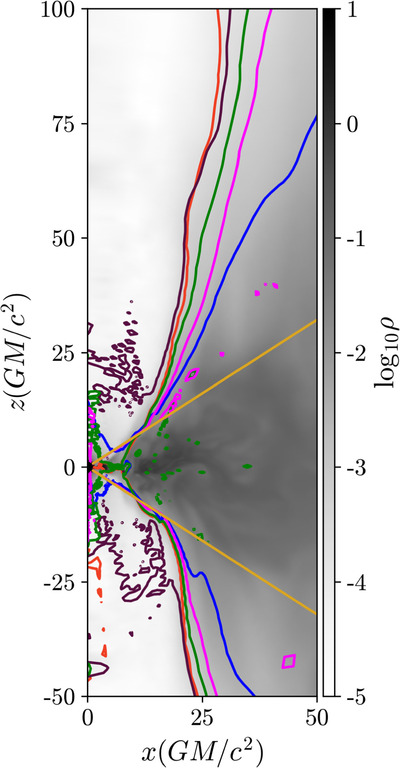
Caption: Figure 19.
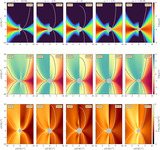
A poloidal cut of an MAD simulation illustrating various definitions of a jet or outflow. The background color saturation represents rest-mass density in code units. The gold lines mark geometric boundaries at θ = 1 and θ = π − 1, which are used in this work to compute the total outflow power Pout. The blue line is the −ut = 1 contour, while the magenta line represents βγ = 1, the latter serving as the jet definition in this study. The green, plum, and red lines indicate contours where μ = 1, Be = 1 (fluid Bernoulli parameter), and σ = 1, respectively.
Other Images in This Article
Show More
Copyright and Terms & Conditions
© 2025. The Author(s). Published by the American Astronomical Society.

Copyright ©
2026 Astronomy Image Explorer. All Rights Reserved.
