

Image Details
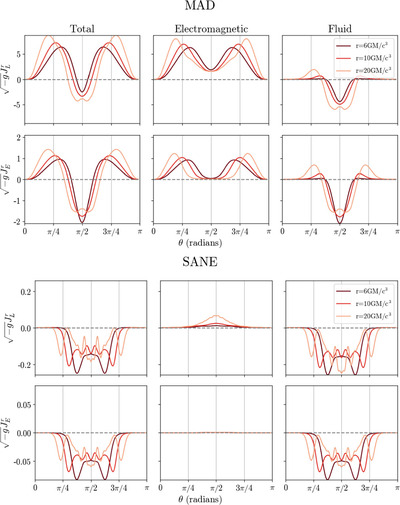
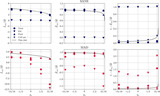
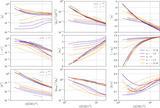
Caption: Figure 12.
﹩{{\mathfrak{J}}}_{L}﹩ and ﹩{{\mathfrak{J}}}_{E}﹩ colatitude dependence at three radii r = 6, 10, 20rg. The top (bottom) two rows correspond to the simulation shown in Figure 11 (Figure 13). For each simulation, we show in the top (bottom) row the angular momentum (energy) current. The left column plots the total current, while the middle and right columns plot the electromagnetic and fluid contribution, respectively. In the MAD simulation, we see outward transport of energy and angular momentum flux in the jet carried by the collimated magnetic fields, while the fluid stresses are inward and peak in the disk. The total current closely resembles the fluid sector profile for the SANE simulation with some outward electromagnetic angular momentum flux in the disk.
Other Images in This Article
Show More
Copyright and Terms & Conditions
© 2025. The Author(s). Published by the American Astronomical Society.

