Image Details
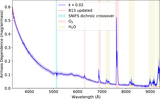
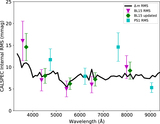
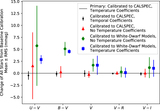
Caption: Figure 9.
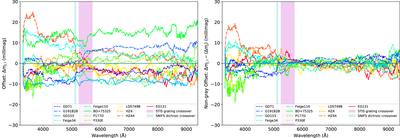
The Δm l values for each star showing the offset with respect to CALSPEC. On the left, we show the full Δm l for each star, making plain that most of the power is in the form of constant-in-wavelength offsets. On the right, we have removed the constant term in order to highlight the chromatic components. The vertical blue-shaded region shows the SNIFS dichroic crossover wavelength range; there does not appear to be much structure between the blue and red sides of SNIFS. The vertical magenta-shaded band is the region where the CALSPEC HST observations change grating coverage. The values have been median-smoothed in wavelength for clarity. Only primary calibrators observed on more than one night are shown, since otherwise the per-observation repeatability dominates, forcing the Δ m l to fall back on the prior, σ l .
Other Images in This Article
Show More
Copyright and Terms & Conditions
© 2022. The Author(s). Published by the American Astronomical Society.