Image Details
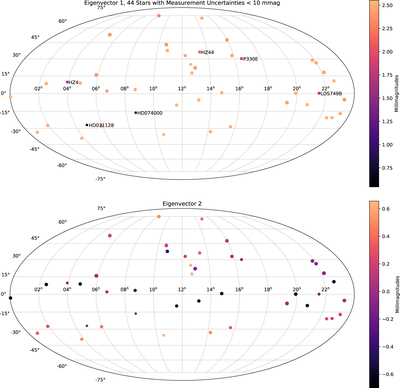
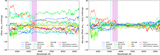
Caption: Figure 6.
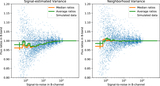
We show eigenvectors constructed from the star-to-star covariance of the mean flux of each star averaged across 4000–7000 Å (to improve signal-to-noise ratio compared to a single wavelength). The off-diagonal elements of the covariance matrix are decomposed into first one eigenvector (shown in the top panel) and then after removing the outer product of that vector with itself, the remaining off-diagonal covariance matrix is decomposed into the next vector (shown in the bottom panel). The linear size of the plot points indicates the inverse uncertainty of each star. The first eigenvector is nearly constant from star to star, and the ∼2.5 mmag scale indicates the high precision of the match of our network to CALSPEC. Our model naturally gives this uncertainty from the number of CALSPEC stars, the number of observations, the estimated internal consistency of our network vs. CALSPEC, the repeatability of SNIFS, and the signal-to-noise ratio of the observations. The second vector shows very small (∼1 mmag) correlations on the sky.
Other Images in This Article
Show More
Copyright and Terms & Conditions
© 2022. The Author(s). Published by the American Astronomical Society.