Image Details
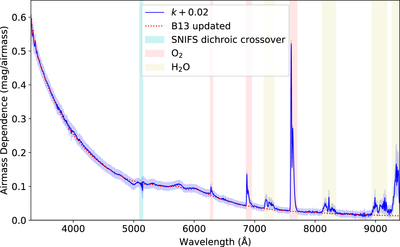
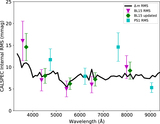
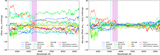
Caption: Figure 7.
The airmass-dependent term, k, plotted vs. wavelength for our primary (extinction linear in airmass) analysis. For comparison purposes, we have added the 20 mmag gray instrumental component discussed in Section 5.2. The blue line is the mean k, and the blue band is the inferred rms of the night-to-night variation in k. Major atmospheric features are marked, as is the wavelength range of the SNIFS dichroic crossover. A physical atmospheric model, updated from Buton et al. (2013) to include updated ozone cross sections from Serdyuchenko et al. (2014) and a 40% reduction in the amount of aerosol scattering, is shown as the red dashed line. (Note that Buton et al. 2013 modeled telluric lines in a separate step, so for their curve, the telluric features are not included.) We see overall good agreement between our wavelength-by-wavelength model and a physical model. Note that no smoothness constraint in wavelength is imposed, so this agreement is an excellent cross-check.
Other Images in This Article
Show More
Copyright and Terms & Conditions
© 2022. The Author(s). Published by the American Astronomical Society.