Image Details
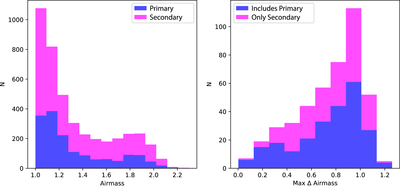
Caption: Figure 3.
Histograms showing the incidence of standard-star observations per airmass (left) and airmass range (right). The values are color coded by the sample—primary (blue) or secondary (magenta)—to which each standard star or pair of standard stars belongs. For the airmass range calculation, a pair is categorized as “primary” if at least one star in the pair is one of our primary standard stars. These distributions demonstrate that the airmass values and ranges are very similar for the primary (space-based CALSPEC) and secondary (SSPS; Oke 1990) standard stars.
Other Images in This Article
Show More
Copyright and Terms & Conditions
© 2022. The Author(s). Published by the American Astronomical Society.
Copyright ©
2025 Astronomy Image Explorer. All Rights Reserved.