Image Details
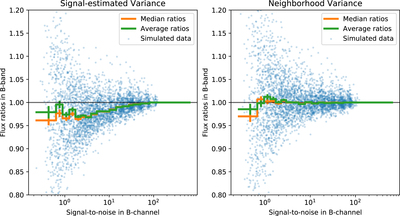
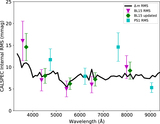
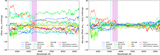
Caption: Figure 5.
Results of simulations to test the linearity of our extract_star2 software that measures 1D spectra from SNIFS data cubes. On the left is shown a simulation in which a PSF vs. wavelength is fit to the data cubes using as weights the photon and readout noise variance spectrum estimated directly from the signal. On the right is shown the cases where the initial signal-estimated variance spectrum is smoothed in wavelength, leaving out the target wavelength and the two adjacent from the kernel, thereby decorrelating the signal and the weights. Using the variance spectrum directly results in a strong bias with S/N, whereas using the smoothed variance does not. The simulations used to produce these results take high S/N standard-star data cubes and add noise that simulates fainter and fainter stars. Overall, this test spans a factor of 5000× in brightness, corresponding to a range of 9.25 mag. We performed ∼16,200 of these simulations across all spectra for 10 different standard stars in order to sample over a wide range of PSF shapes.
Other Images in This Article
Show More
Copyright and Terms & Conditions
© 2022. The Author(s). Published by the American Astronomical Society.