Image Details
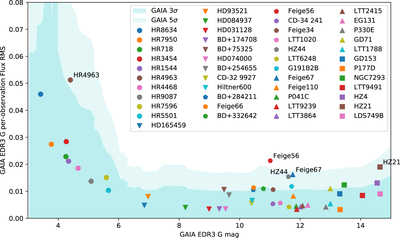
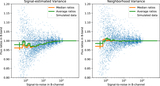
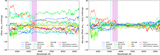
Caption: Figure 2.
The per-transit rms of the Gaia G magnitude vs. the G magnitude. The rms includes Gaia measurement errors and any stellar variability that may be present. The legend identifies stars in order of their G-band magnitude. The cyan-shaded regions indicate the 3σ and 5σ measurement uncertainty ranges expected from the typical Gaia measurement accuracy (taken from Riello et al. 2021). Stars with significant rms—larger than 0.015 mag and 3σ larger than the expected measurement uncertainty—are labeled.
Other Images in This Article
Show More
Copyright and Terms & Conditions
© 2022. The Author(s). Published by the American Astronomical Society.
Copyright ©
2025 Astronomy Image Explorer. All Rights Reserved.