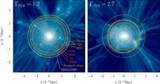
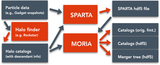
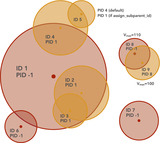
Image Details
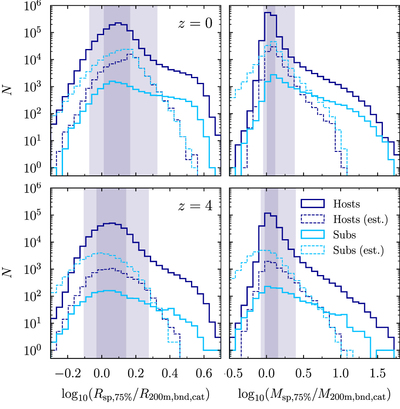
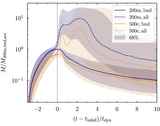
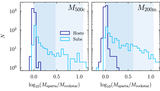
Caption: Figure 9.
Ratio of the 75%-splashback radius and mass to ﹩{R}_{200{\rm{m}}}﹩ (left) and ﹩{M}_{200{\rm{m}}}﹩ (right), for z ≈ 0 (top) and z = 4 (bottom). The histograms include all halos in the WMAP7 sample with ﹩{N}_{200{\rm{m}}}\gt 1000﹩. The splashback radius depends on the accretion rate and mass, which broadens the distribution. The solid lines show splashback quantities computed by SPARTA, the dashed lines those interpolated or estimated by MORIA. For subhalos, only a small fraction has SPARTA estimates. While the distribution has large tails, the 68% and 95% intervals for hosts (shaded areas) are well confined. The tails for the estimated values are limited by construction as described in Section 4.2. The tails toward high ratios are partially due to outliers with genuinely large splashback radii and partly due to differences between including all particles and the bound-only SO mass to which we are comparing. The broadness of the distributions also highlights that the splashback radius is a unique definition that cannot easily be guessed based on SO definitions. See Section 5.5 for details.
Other Images in This Article
Show More
Copyright and Terms & Conditions
© 2020. The American Astronomical Society. All rights reserved.